
Selective Risk Rating in Practice: Pinpointing CPPs and CMAs for an AEX Step

Selective Risk Rating in Practice: Pinpointing CPPs and CMAs for an AEX Step
Most discussions of risk-based process development stay at the level of principle. This one is deliberately concrete: a single anion exchange chromatography step, seven parameters, and what happened to their classifications when data replaced assumption.
The example matters because the gap between the two approaches is usually invisible in a summary. It becomes obvious when you look at the parameters one at a time.
The rating scale
The assessment uses a four-level impact classification, describing the effect of a process parameter or material attribute on a specific critical quality attribute - here, virus clearance:
- A - impact has been observed
- B - impact is expected
- C - impact is not expected, or is negligible
- D - impact is excluded
Before evidence is gathered, most parameters sit at B. That is the honest position under uncertainty: impact is plausible, and nothing rules it out. The problem is that B is also an expensive position, because it obliges controls without establishing that they protect anything.
Before and after
Following process characterization and virus clearance studies supported by surrogate DoE, mechanistic modeling and platform knowledge, the seven parameters resolved as follows.
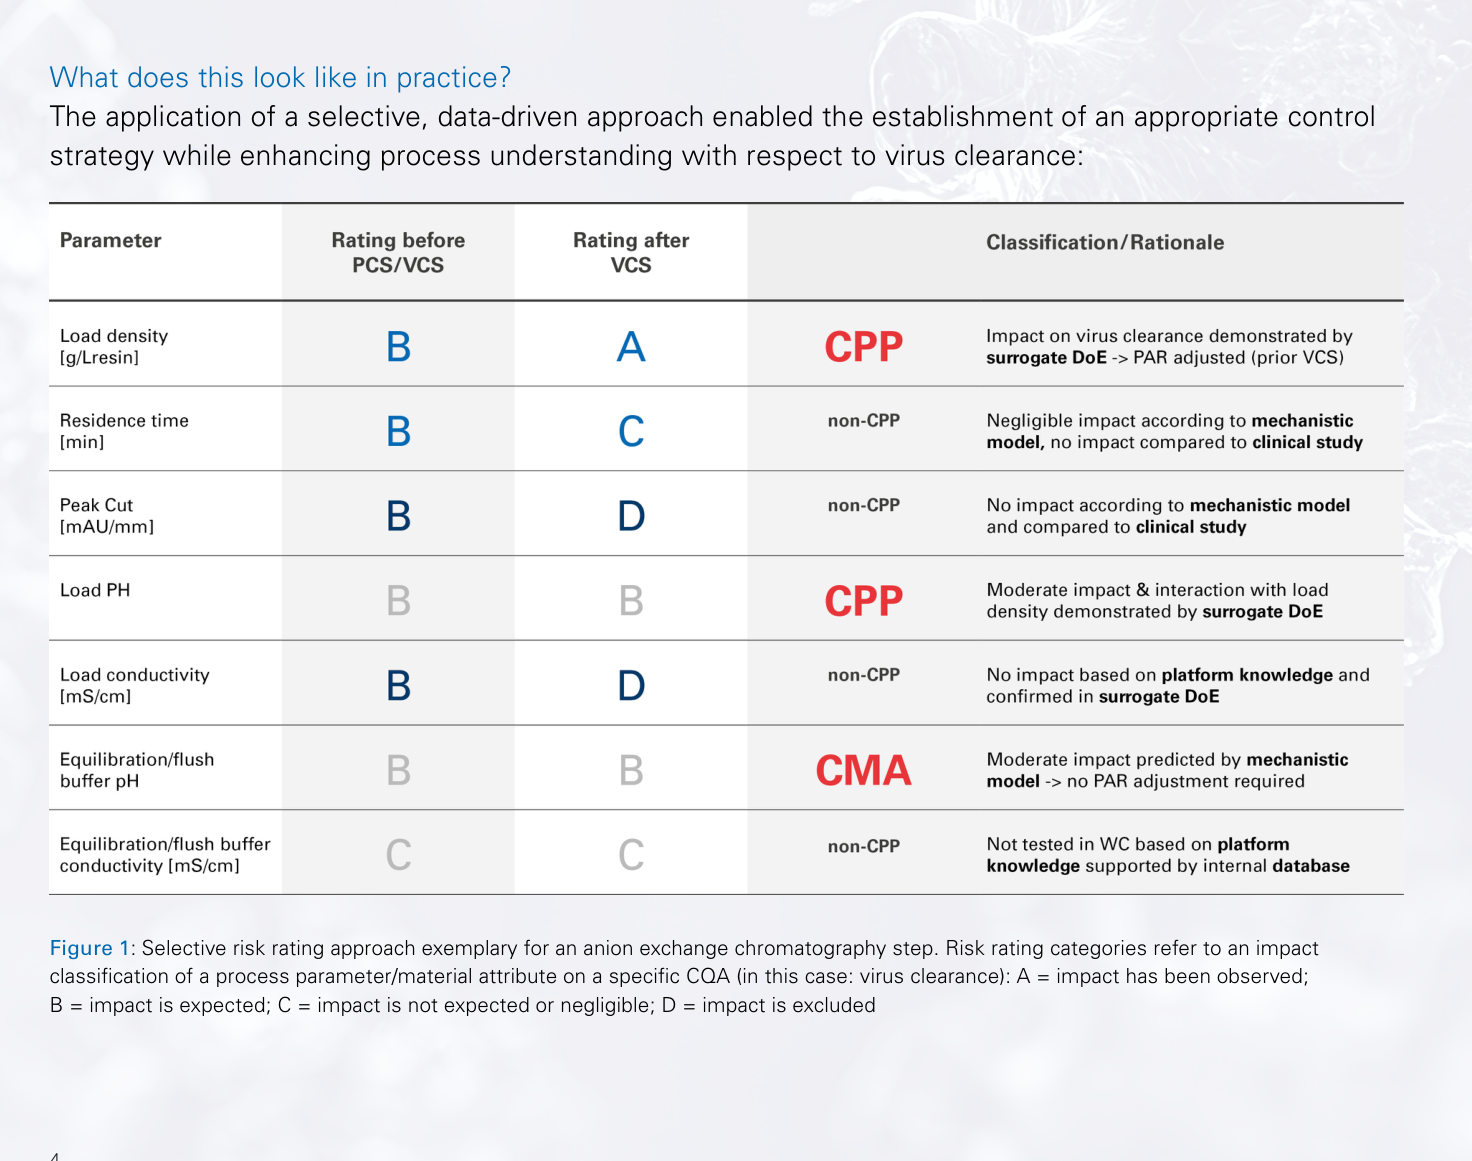
Reading the table by outcome rather than by row makes the pattern clear.
Parameters that were confirmed critical
Load density moved from B to A - impact on virus clearance was directly demonstrated by surrogate DoE, and it became a CPP with its proven acceptable range adjusted accordingly. This is evidence working in the demanding direction: the study did not simply relax constraints, it tightened one where the data justified it.
Load pH remained at B but was classified a CPP, on the basis of moderate impact and an interaction with load density demonstrated by surrogate DoE. Interactions of this kind are precisely what worst-case testing cannot detect - and precisely what makes control strategies fail when they are missed.
Equilibration/flush buffer pH stayed at B and was designated a CMA, with moderate impact predicted by mechanistic modeling. Notably, no PAR adjustment was required: the model quantified the effect well enough to show the existing range was adequate.
Parameters that were released
Residence time dropped from B to C - negligible impact according to the mechanistic model, with no impact seen in the clinical study.
Peak cut dropped from B to D - impact excluded, again by mechanistic model and clinical comparison.
Load conductivity dropped from B to D, based on platform knowledge and confirmed in surrogate DoE.
Equilibration/flush buffer conductivity remained at C throughout, not tested in worst case because platform knowledge supported by an internal database already justified the rating.
What the pattern shows
Three CPPs/CMAs; four parameters released from suspicion. Under a conventional approach, most or all seven would have retained B ratings and attracted controls.
The interesting detail is the methodological diversity. No single technique carried the analysis: surrogate DoE demonstrated the load density and load pH effects, mechanistic modeling settled residence time, peak cut and buffer pH, platform knowledge and an internal database resolved both conductivity parameters, and clinical study data corroborated several conclusions.
Any one of these tools alone would have left questions open. Together they resolved every parameter - which is the practical argument for building all three capabilities rather than picking one.
Why this beats the alternatives
There are two conventional approaches, and the selective method outperforms both.
Conservative retention of B ratings keeps every parameter under control indefinitely. It is safe in appearance but costly in practice: unnecessary controls constrain manufacturing for the life of the product, and each one is a potential deviation.
Progressive down-rating without resolving individual effects - concluding from an adequate worst-case result that nothing needs tight control - is the more dangerous error. It reaches conclusions the data does not support, and it would have missed the load pH / load density interaction entirely.
The selective approach yields defensible, parameter-specific criticality: each classification carries its own rationale and its own evidence. That is what makes it both safer and leaner than the alternatives.
What it means for a control strategy
The resulting control strategy is materially different from the conservative default. Tight control and close monitoring apply to load density, load pH and equilibration buffer pH. The other four parameters are managed without the overhead of critical-parameter treatment.
For a commercial process running for years, that difference compounds - in batch record complexity, in deviation frequency, in investigation burden, and in the flexibility available when something inevitably drifts.
And when a deviation does occur, the mechanistic model that classified a parameter can be used again to assess it. The evidence base built during development keeps paying out across the commercial lifecycle.
Rentschler Biopharma's downstream process science team builds selective, evidence-based control strategies for complex biologics. To discuss parameter classification for your process, contact our Business Development team.